How many times have you been asked to provide statistics related to your sales funnel when working with a coach, and you had no idea how to answer?
I'm going to show you a very simple way of checking your Google Analytics profile to take a few key measurements.
Install Google Analytics
First of all, you must have a Google Analytics account and install the code on your website.
1. Go to analytics.google.com to set up your account.
2. Click on the Admin gear to see your admin panel.
3. Click on Tracking info to get to your ID.

4. The ID is housed under Tracking Code.

5. Install it on your website according to your website platform's instructions.
Check Behavior Statistics
Once you've had your Google Analytics code taking measurements from your site for at least a week, you can see statistics related to where people are trafficking your site.
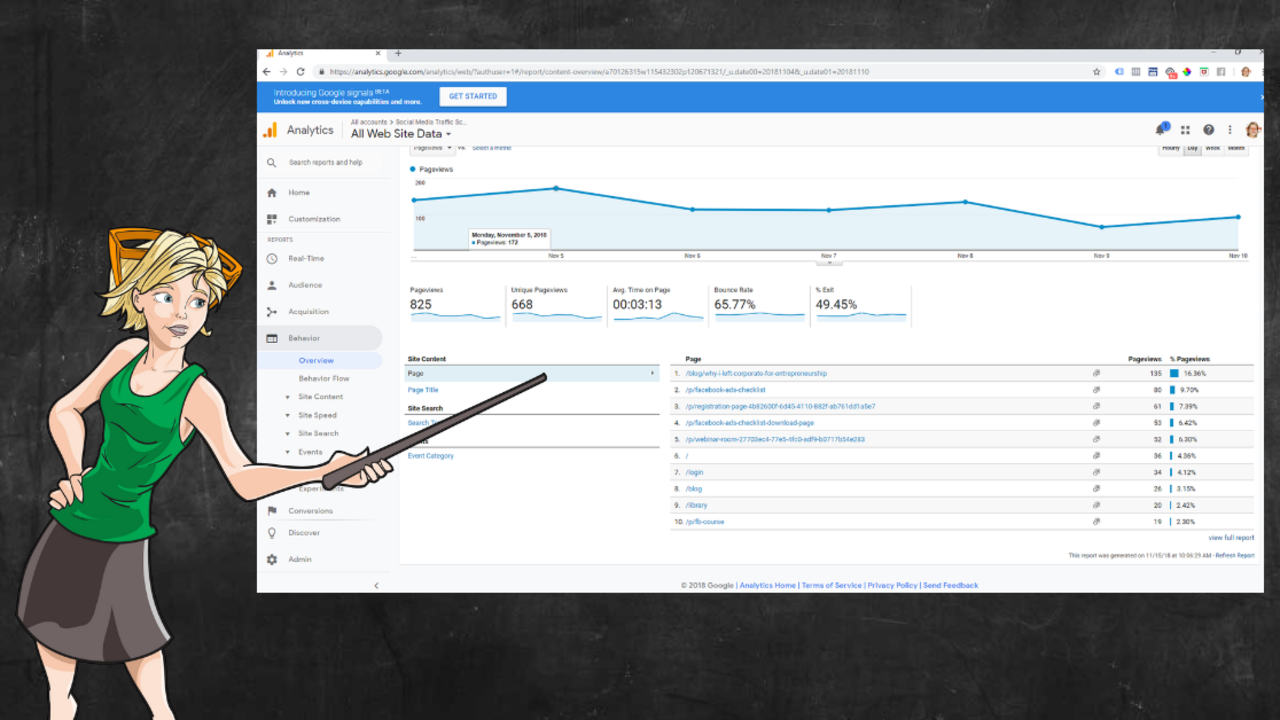
1. Go to Behavior in your sidebar menu, then click on Overview.

2. Look to the right at the traffic across your website.
3. On the bottom right, you'll see the top 10 pages that get traffic. Look for your opt-in landing page and thank you page in this list, as well as your sales page.

Interpret Results of Your Website Traffic
In this example, #2 is the opt-in landing page, #4 is the thank you page, and #10 is the sales page. The opt-in conversion rate is 53 / 80 = 66.25%. That's the thank you page views divided by the landing page views. If someone makes it to your thank you page, that means they input their email address and converted to become a lead.
The number of views of the sales page is 19. That means that it took 53 leads to get 19 views of the sales page. Emails and additional web pages were presented to those leads to get them to the sales page with nurturing sequences.
This sales page happens to convert at 2%, meaning that out of the 19 views, we would expect 0.38 sales. Since you can't have under 1 sale, we'd have to measure a longer period than this one week's worth of traffic. At this rate, we would have one sales conversion each month. (19 x 4 x 2% = 1.52) Round this to 1 sale, since you can't have 1.52 sales.
Is that enough for your business? How can you get more eyes on your sales page? That's the goal here, isn't it?
Set Goals and Track Funnels
Need Help Understanding Website Visitor Behavior Flow?
Check out this video to see where people are trafficking your site.
Next Steps to Increase Traffic
Discover how we increase traffic to our sales pages with properly warmed up traffic with our course and mastermind.
Get content-making tips and my FUNNY HOLIDAYS calendar for FREE for daily content inspiration!

Stand UP for What You Believe In & Stand OUT From the Crowd!
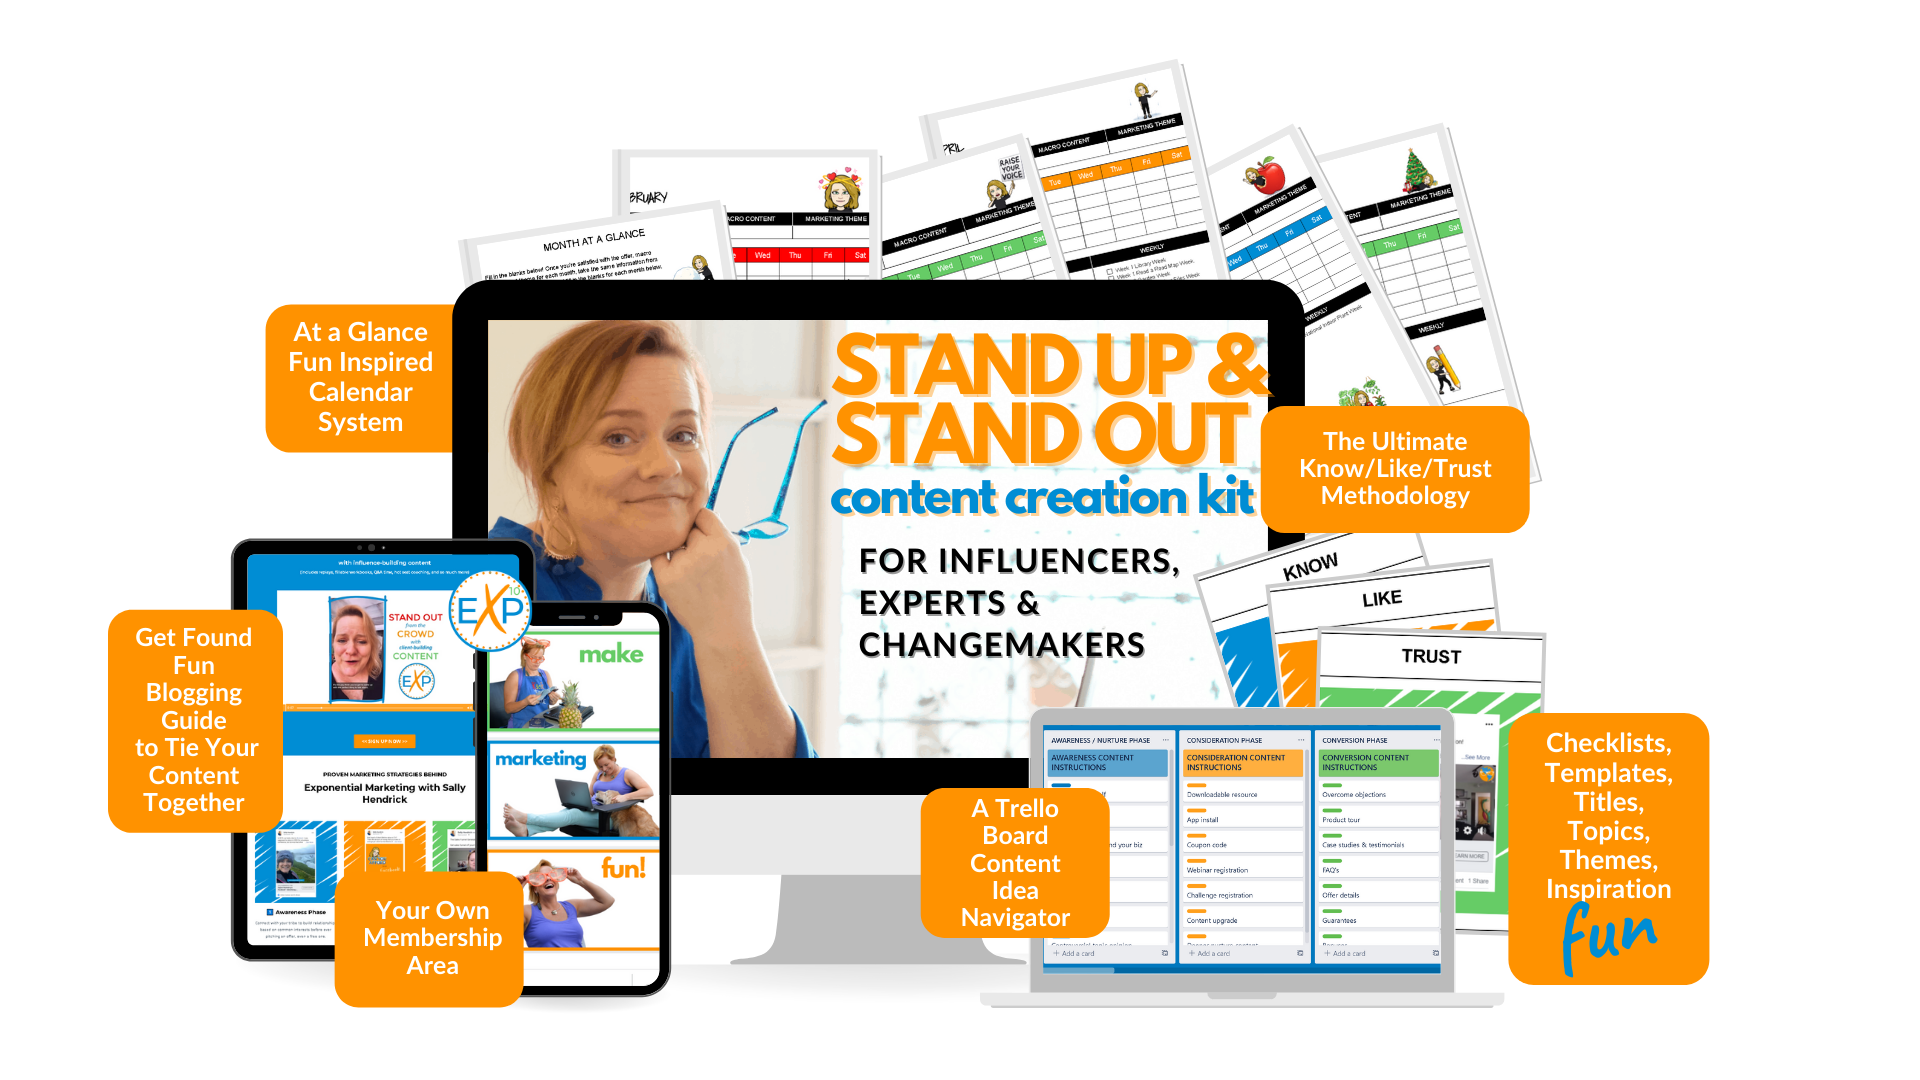
Make EXPLOSIVE & Influential Content with this All-in-One Kit!